Analytics
Conversation counts, payable conversations, messages, resolution rate, and time series for this agent.
The Analytics tab summarizes how this agent performs over time: volume, depth, and simple outcome metrics.
Before you read the numbers
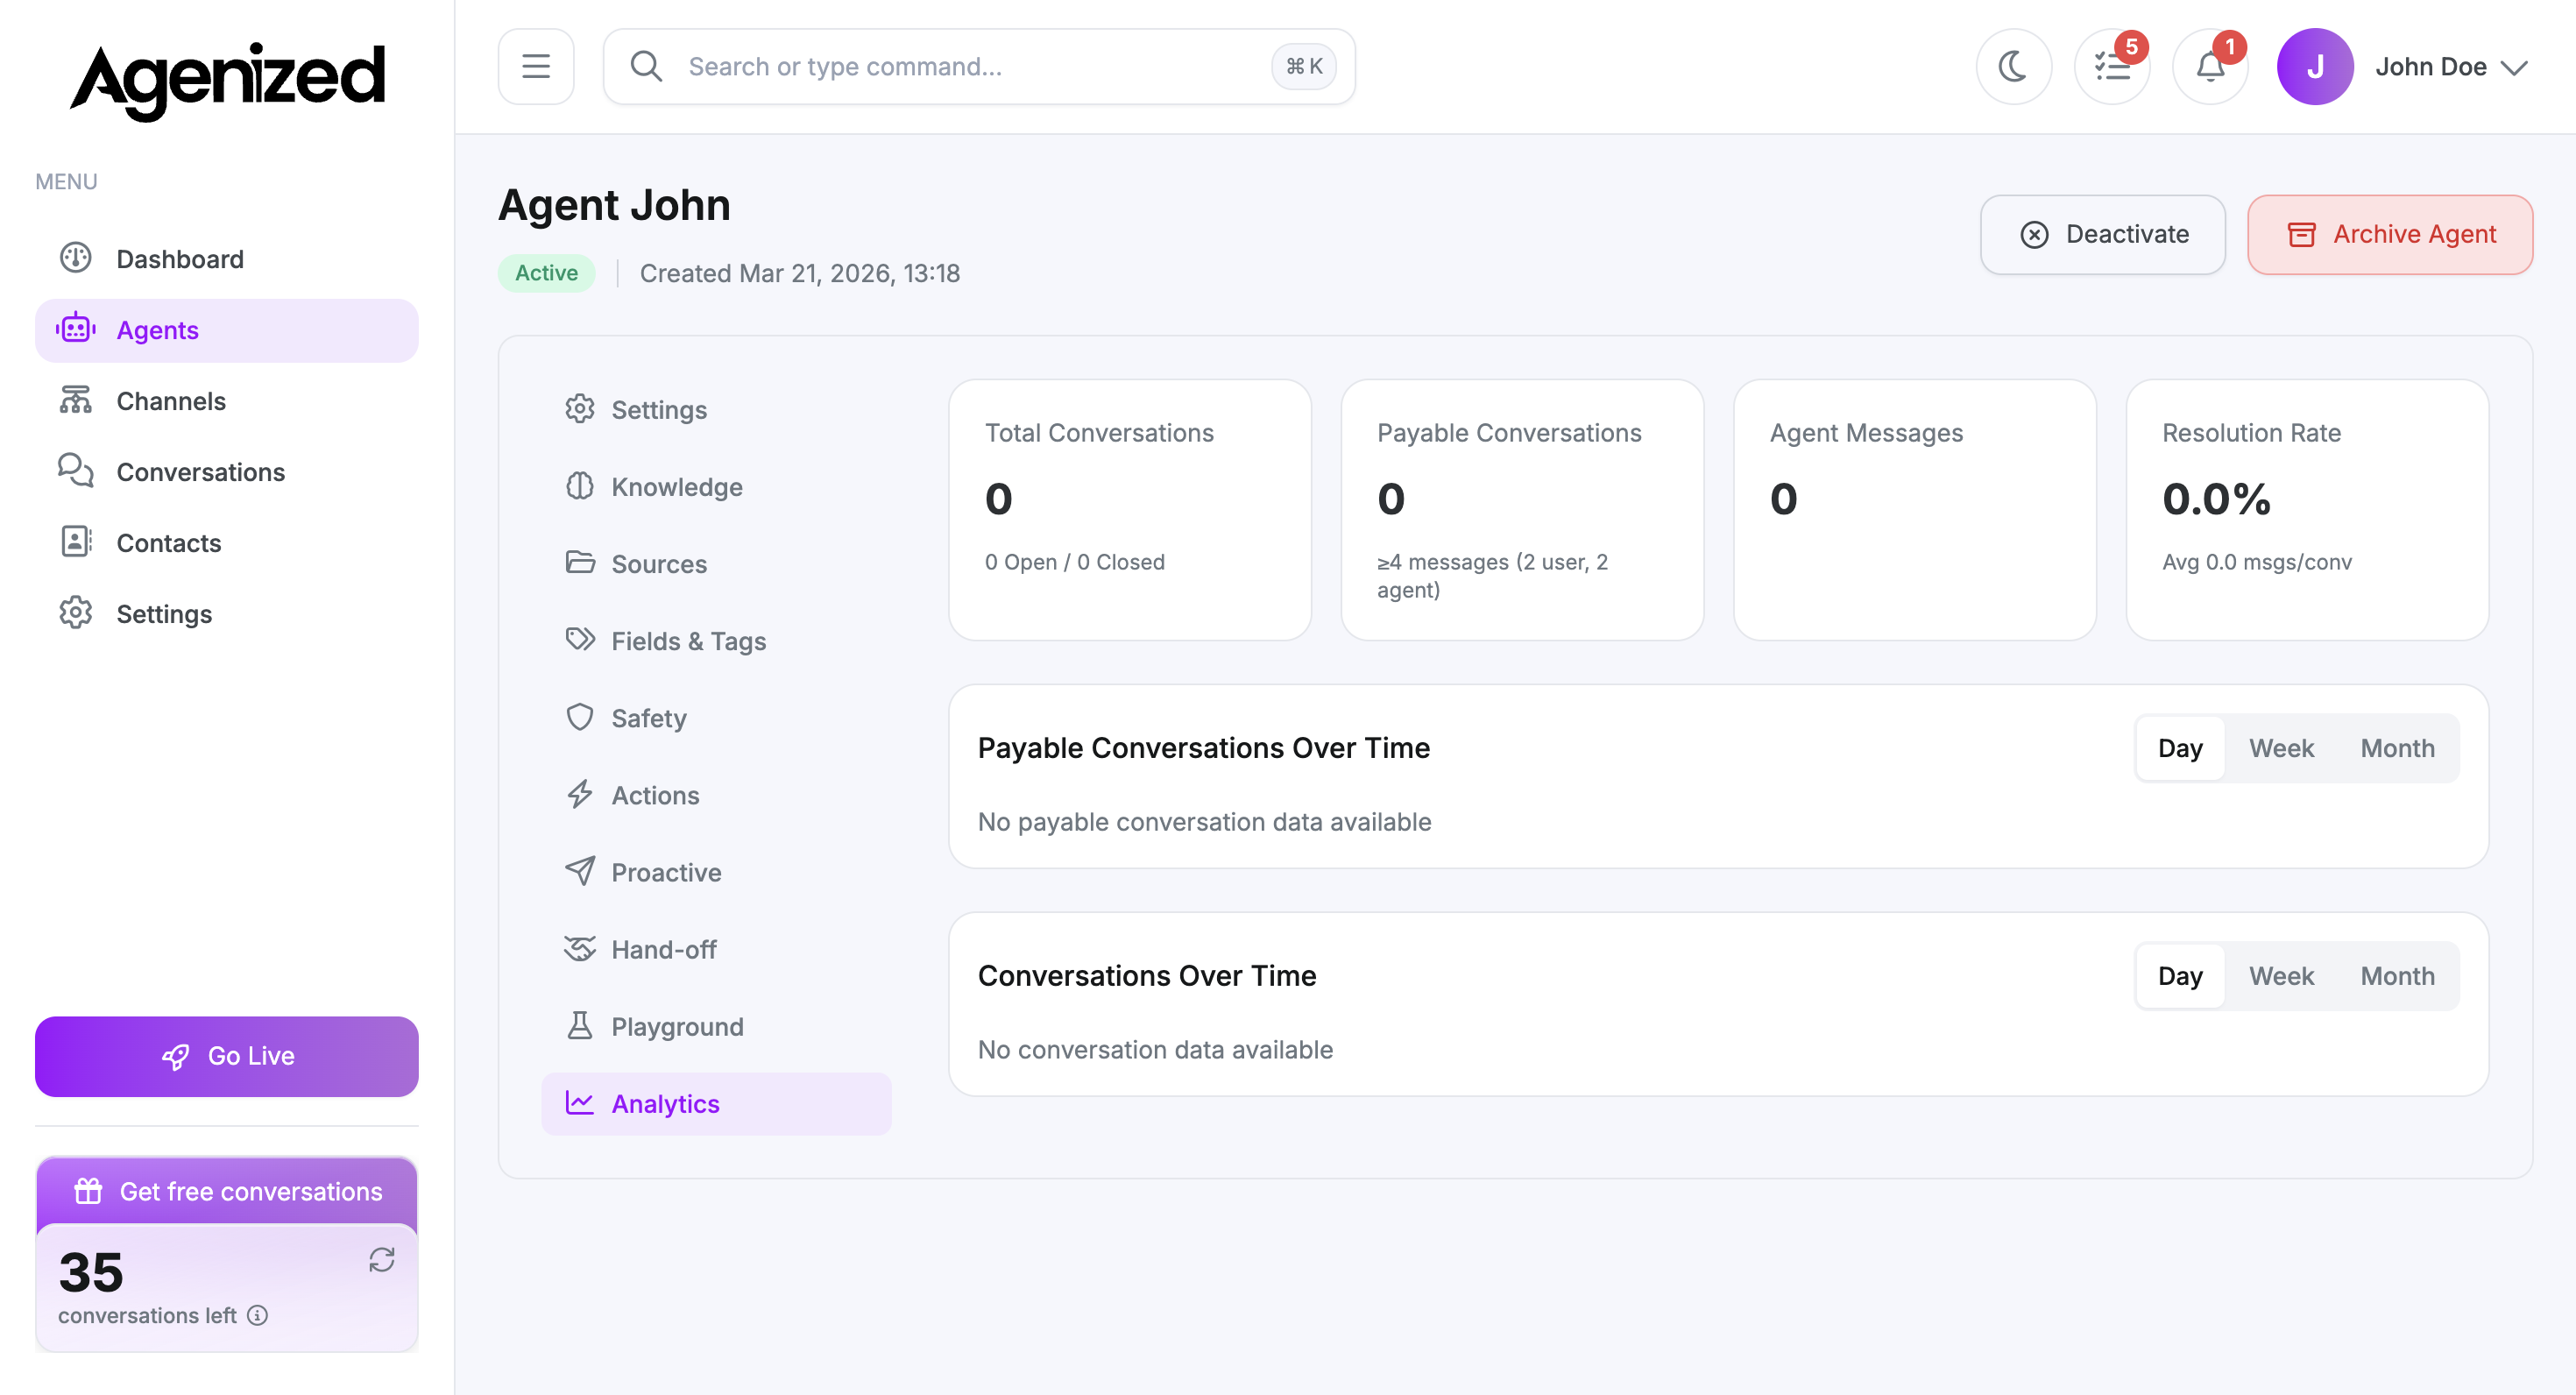
If your agent is new or has not handled traffic yet, cards and charts may show zeros and messages like “No conversation data available.” That is expected. Add a few test conversations in Playground or a staging channel, then revisit this tab after data pipelines update.
If you want screenshots with visible trends for documentation or marketing, run representative traffic first, then capture the page again.
Summary cards
Typical tiles include:
-
Total conversations (open vs closed split).
-
Payable conversations (conversations that meet your plan’s depth threshold, for example minimum user and agent messages).
-
Agent messages volume.
-
Resolution rate and average messages per conversation (definitions follow your workspace configuration).
Time series
Payable conversations over time and Conversations over time support Day, Week, and Month granularity. Switch the range to match how you review performance.
Using analytics operationally
- Compare weeks after you change instructions or Sources.
- Correlate spikes with marketing campaigns or Channel changes.
- Pair with account-level reporting if your plan exports data elsewhere.